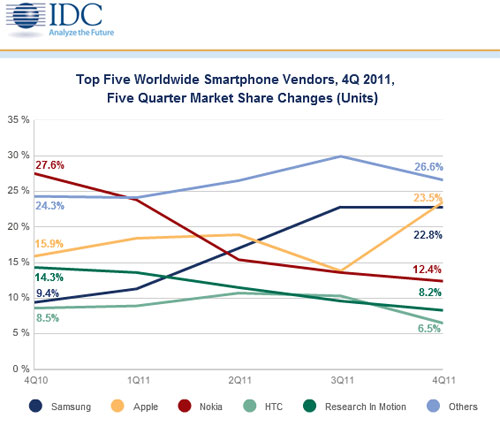
IDC przygotowało raport podsumowujący IV kw. i cały 2011 r. na rynku smartfonów. Według badania International Data Corporation (IDC) Worldwide Mobile Phone Tracker w IV kw. producenci sprzedali 157.8 mln sztuk smartfonów, w porównaniu do 102 mln rok wcześniej. W całym 2011 r. producenci sprzedali 491.4 mln smartfonów - o 61.3% więcej niż w 2010 r. (304.7 mln). IDC przyznało, że prognozy tej firmy się nie sprawdziły (były zaniżone).
Top Five Worldwide Smartphone Vendors, Shipments, and Market Share, Q4 2011 (Units in Millions)
| Vendor | Q4 2011 Shipment Volumes | Q4 2011 Market Share | Q4 2010 Shipment Volumes | Q4 2010 Market Share | Year Over Year Change |
| Apple | 37.0 | 23.5% | 16.2 | 15.9% | 128.4% |
| Samsung | 36.0 | 22.8% | 9.6 | 9.4% | 275.0% |
| Nokia | 19.6 | 12.4% | 28.1 | 27.6% | -30.6% |
| Research In Motion | 13.0 | 8.2% | 14.6 | 14.3% | -11.0% |
| HTC | 10.2 | 6.5% | 8.7 | 8.5% | 17.2% |
| Others | 42.0 | 26.6% | 24.8 | 24.3% | 69.4% |
| Total | 157.8 | 100.0% | 102.0 | 100.0% | 54.7% |
źródło: IDC Worldwide Mobile Phone Tracker, February 6, 2012

Top Five Worldwide Smartphone Vendors, Shipments, and Market Share Calendar Year 2011 (Units in Millions)
| Vendor | FY 2011 Shipment Volumes | FY 2011 Market Share | FY 2010 Shipment Volumes | FY 2010 Market Share | Year Over Year Change |
| Samsung | 94.0 | 19.1% | 22.9 | 7.5% | 310.5% |
| Apple | 93.2 | 19.0% | 47.5 | 15.6% | 96.2% |
| Nokia | 77.3 | 15.7% | 100.1 | 32.9% | -22.8% |
| Research In Motion | 51.1 | 10.4% | 48.8 | 16.0% | 4.7% |
| HTC | 43.5 | 8.9% | 21.7 | 7.1% | 100.5% |
| Others | 132.3 | 26.9% | 63.7 | 20.9% | 107.7% |
| Total | 491.4 | 100.0% | 304.7 | 100.0% | 61.3% |
źródło: IDC Worldwide Mobile Phone Tracker, February 6, 2012


